
May 26, 2022
Abby Nuttall
Driver Articles
When considering which places to visit or move to, one often overlooked aspect of everyday life is how good each city is as an overall driving experience.
Wessex Fleet analysed 25 of the biggest and most popular cities in the UK to find out once and for all which are the best, and subsequently the worst, for driving in.
Key Findings
- Reading tops the list as the best city for driving, with Bristol as the worst
- Stoke-on-Trent has had the least city centre crashes
- Edinburgh keeps drivers waiting with the highest congestion times
- Leeds has a poor ratio of car parking spaces to registered vehicles
- Coventry has the highest number of EV charging devices per 100,000 people
- Liverpool has fewer cars on the roads with the lowest number of vehicles per capita
- Hull and Sunderland have the best quality road surfaces
- Portsmouth has the least bus routes in the city
Reading Tops the List as the Best City for Driving
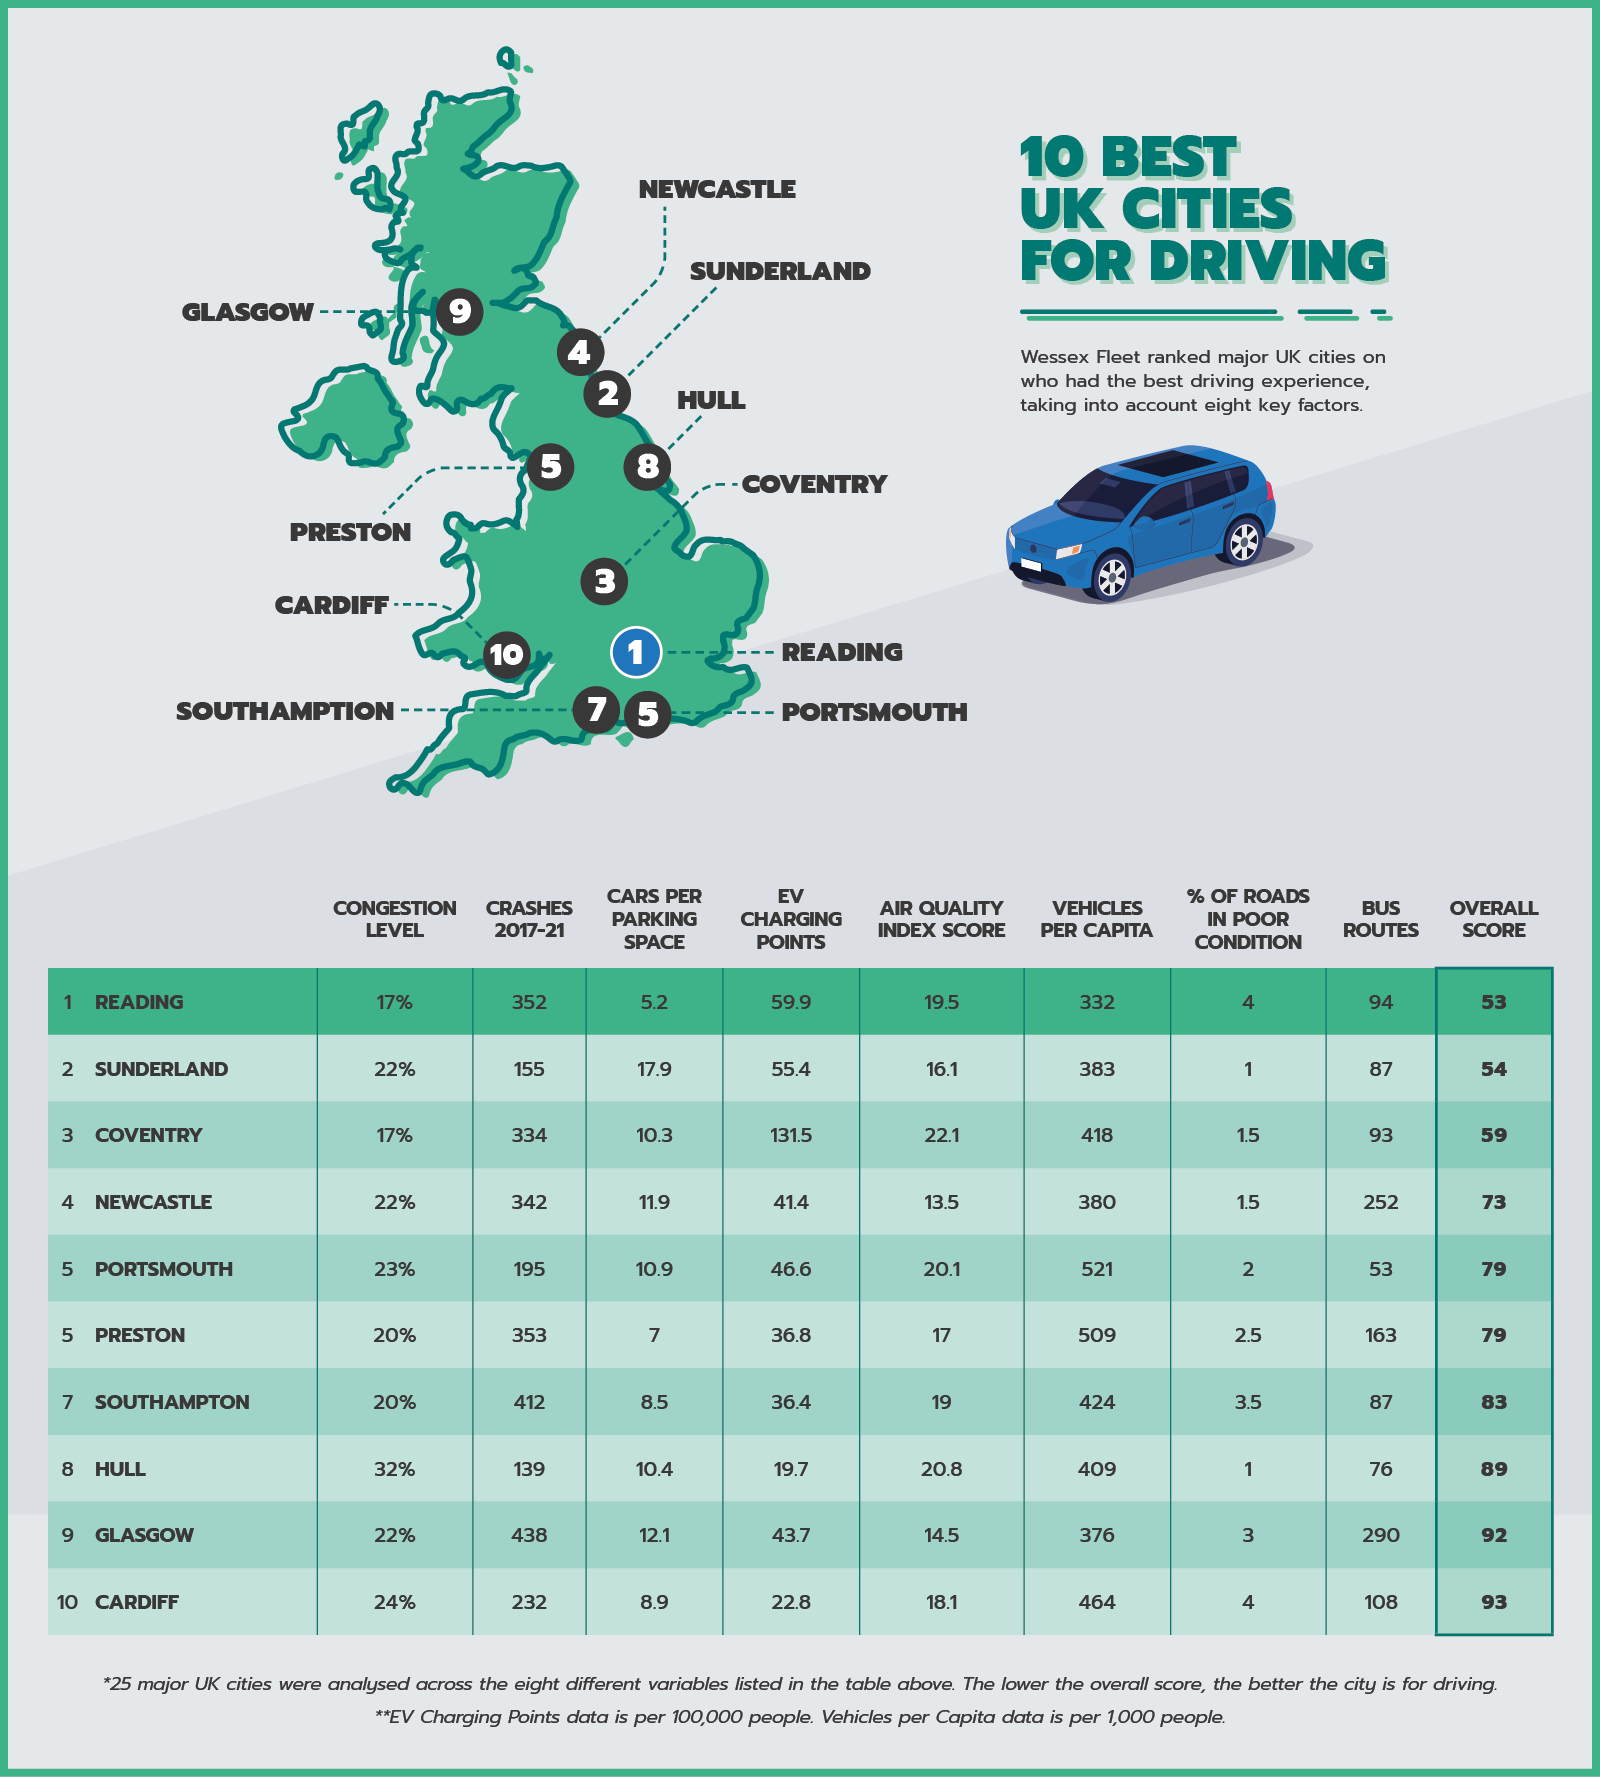 For the purpose of this study, we reviewed eight variables and gave every city a score from 1-25 for each, with the overall score being derived from the sum of each individual variable score. The lower the overall score, the better it is for driving.
Reading reigns supreme at the top of our list with a low overall score of 53, after scoring well in the number of cars per parking space (1st), congestion (2nd), number of vehicles per capita (3rd), and number of EV charging points (4th) in particular.
In second is Sunderland with 54, with the Wearside city pipping their Tyneside rivals Newcastle who are fourth on 73. Sunderland gained the edge by ranking well for road condition (1st), road safety (3rd), bus routes (4th), EV charging points (5th), and air quality (5th).
Coventry rounds out the top three and takes a commendable bronze medal with a score of 59, ranking top for EV charging points (per 100,000 people) and congestion, while also having good quality road surfaces.
Bristol is Revealed as the Worst City for Driving
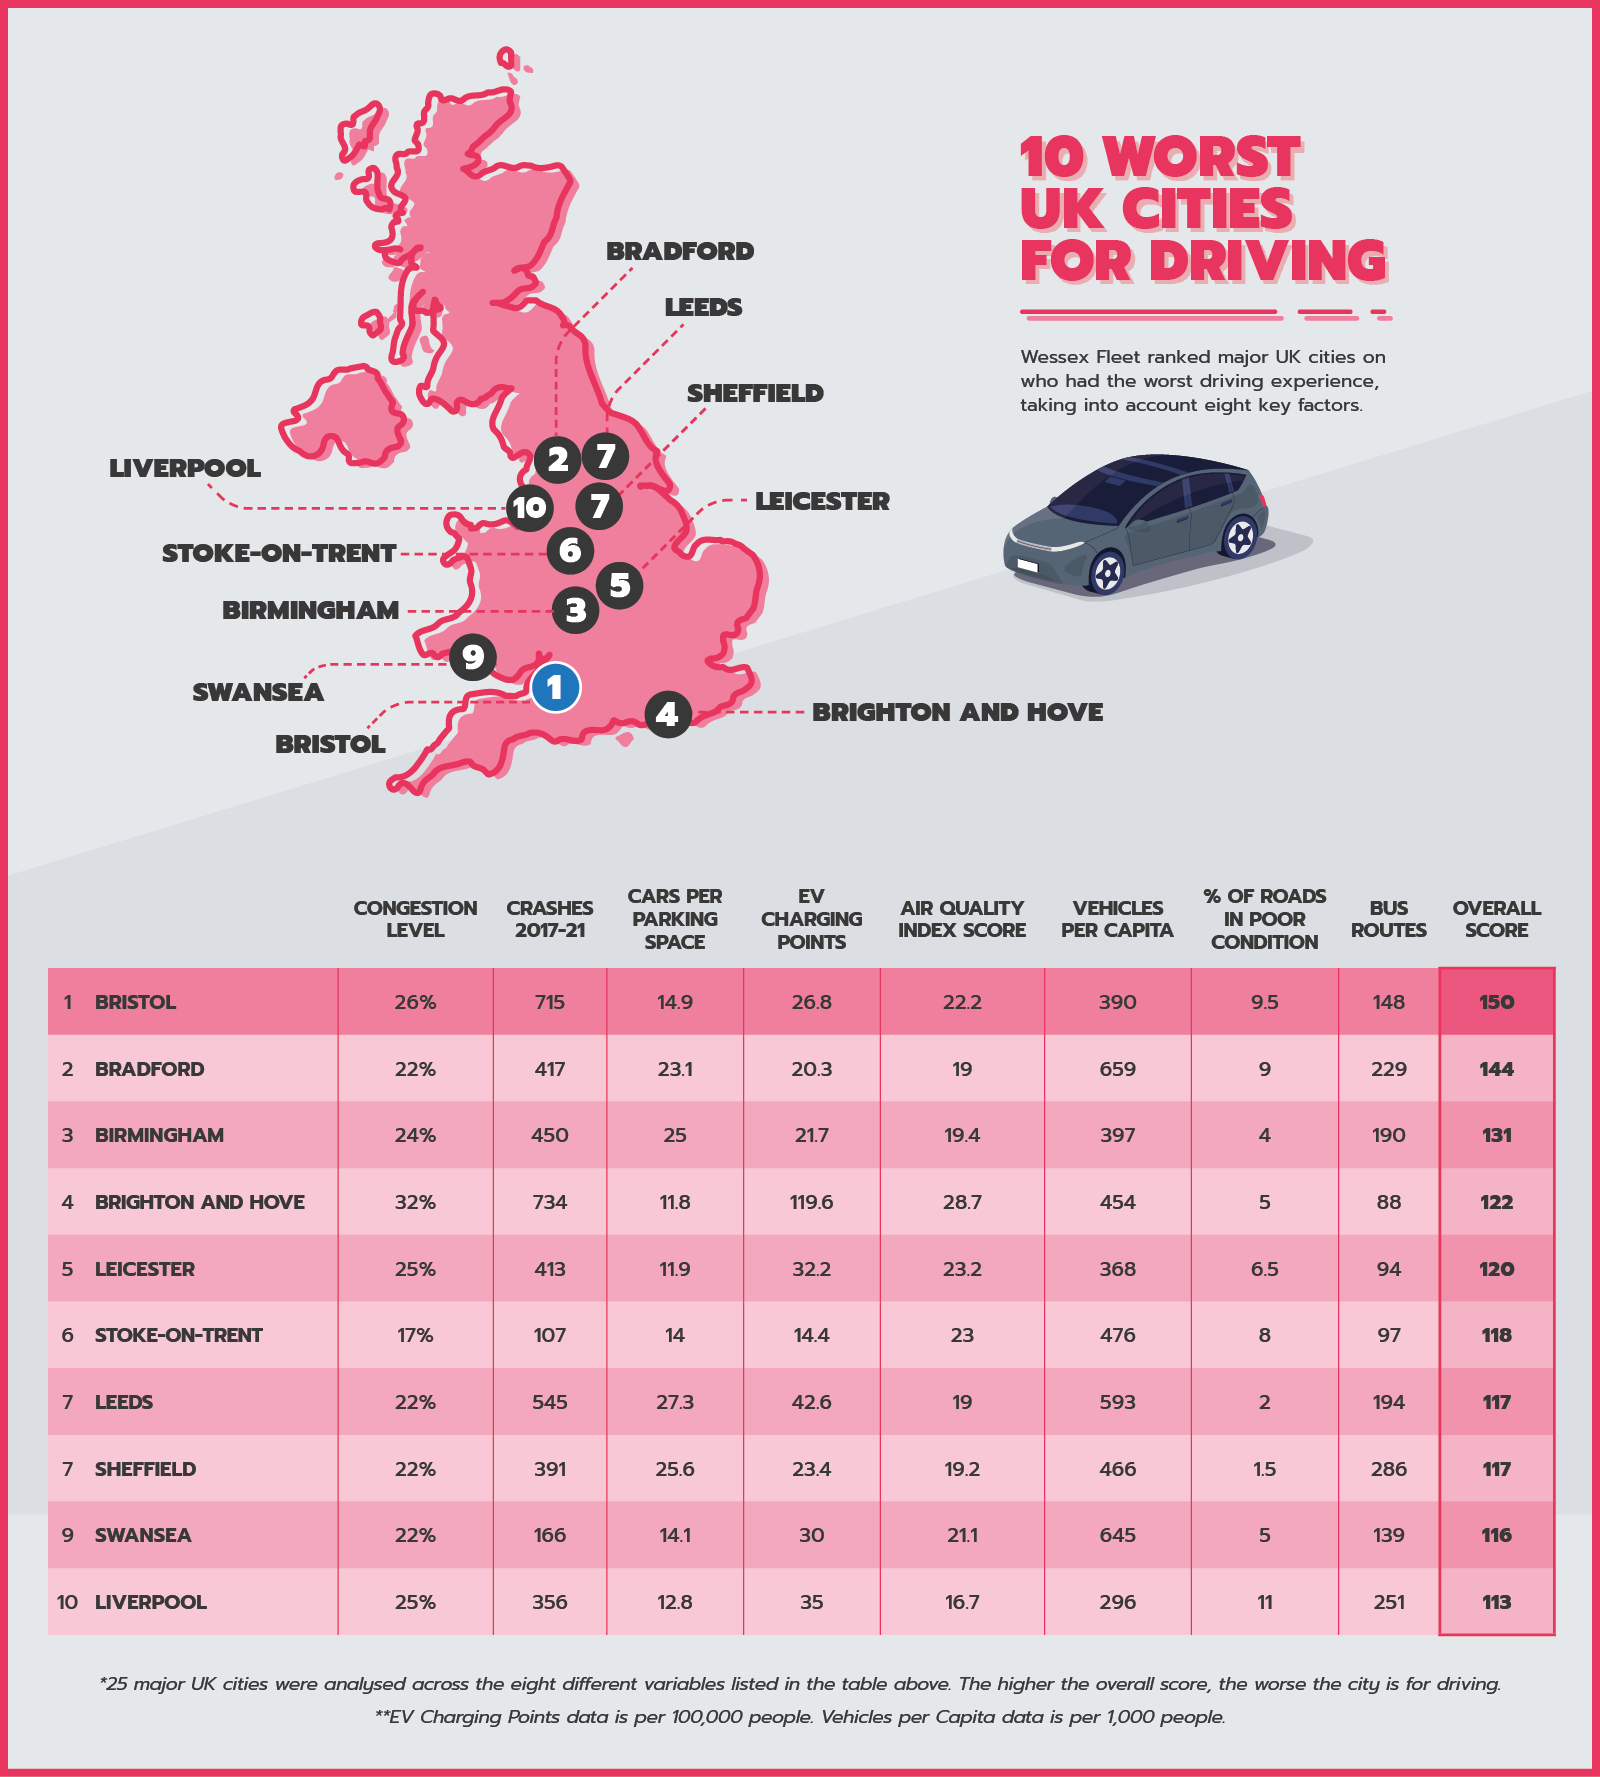
If you want to have a stress free driving experience, our research suggests that avoiding Bristol city centre may be a good piece of advice. The city on the River Avon ranked in the bottom five for numerous variables, including road condition (24th), road safety (23rd), congestion (21st), and air quality (21st), and ended up with an overall score of 150 in our index.
Bradford ranks second bottom of our list with 144, struggling across the board for a whole range of variables. The only part the West Yorkshire city scored well on was congestion (6th), while it was poor for the number of vehicles per capita (24th), road condition (23rd), parking (22nd), and EV charge points (22nd).
Beginning with B may be somewhat of a curse, as it’s Birmingham that rounds out the bottom three with a score of 131. The West Midlands major city was particularly bad for parking (23rd), road safety (20th), and EV charging points (20th).
Stoke-on-Trent Prioritises Safety with the Least City Centre Crashes
Using data from CrashMap, we found that Stoke-on-Trent had only seen 107 city centre crashes between 2017 and 2021, which was 32 less than the next best of Kingston upon Hull with 139 incidents. Drivers in central Sunderland also managed to avoid a high number of collisions with a total of 155 in this five-year period.
It’s not such good news for London though, as they had by far the most city centre crashes with 1,359 since 2017. Though they do have the most people and the most cars, we used the same city centre distance data for all 25 places, and they still came out as the worst for road safety.
Brighton and Hove (734 crashes) and Bristol (715 crashes) also came out poorly in this area, rounding out the bottom of our list and suggesting that these cities aren’t great for inner-city driving, at least from a safety point of view.
Edinburgh Keeps Drivers Waiting with Large Congestion Times
Research from TomTom shows that drivers in Edinburgh are often left frustrated by heavy amounts of traffic congestion in the city, with the 2021 level at 35%, equating to around 80 hours of lost time for drivers simply by sitting in traffic. Unsurprisingly, London is also heavily congested at 33% with 75 hours lost per year. Drivers in Kingston upon Hull and Brighton and Hove also have their fair share of traffic congestion at 32% each.
On the other end of the scale, Coventry, Reading, and Stoke-on-Trent all had the least traffic congestion of the UK cities reviewed, with each at just 17%, averaging at around 39 total hours lost sat waiting in traffic.
Leeds is a Squeeze with a Poor Ratio of Car Parking Spaces to Registered Vehicles
When analysing car parking spaces, we reviewed the ratio of how many cars are registered in each city to how many public parking spaces there are in the city centre car parks, courtesy of data from Parkopedia. This wasn’t good news for Leeds, who had 27.3 cars per parking space, suggesting that it could be tough to get parked in the city centre on a particularly busy day. Sheffield (25.6) and Birmingham (25) also didn’t score well on this metric.
At the top end though, overall winner Reading was first, with just 5.2 cars for every city centre parking space, so you should have an easier time getting parked up there. Nottingham was not too far behind at 6.6 cars per parking space, with Preston rounding out the top three with 7 cars per space.
When looking at the costs of parking, TakePayments.com found that London was unsurprisingly the most expensive, at an average of £5.10 per hour for council parking and £11 per hour for private. Leicester was the cheapest at just £1p/h in council high street parking spaces and £2.20p/h for private.
Coventry is Plugged in for the Electric Car Revolution
When analysing the number of electric vehicle (EV) charging devices per city, it’s Coventry that comes out on top with 131 devices per 100,000 people, with 499 charge points in total. Brighton and Hove and London may have high congestion times, but they are both leading the way in the upcoming EV revolution and have high ratios of public EV chargers, with Brighton at 119 per 100,000 people and London at 111.
Although you’re likely to get a traffic-free drive through Stoke-on-Trent, they ranked bottom of the list for public EV chargers at just 14 per 100,000 people. Kingston upon Hull was also towards the bottom of the list at 19 per 100,000 people, while Manchester only have 20 public chargers per 100,000.
Our previous research found that switching to an EV can save you around £1,000 per year, which could well increase year on year due to the huge rise in petrol and diesel prices. There are plenty of other electric car benefits too, such as being good for the environment, less maintenance and an improved driving experience.
Liverpool Has Fewer Cars on the Roads with the Lowest Number of Vehicles Per Capita
When it comes to having less vehicles on the road, our research determined that Liverpool has the lowest number of vehicles per capita with 296 per 1,000 people. Their local neighbours Manchester are not far behind in this category, with 328 vehicles per 1,000 people, and Reading rounds out the top three at 332 vehicles per 1,000 people.
Bradford currently has the highest number of vehicles per capita with a rate of 659 per 1,000 people, just pipping Swansea for the bottom spot of this list, who are at 645 vehicles per 1,000 people. Leeds rounds out the bottom three with 593 motors per 1,000 people, leading to more cars on the city roads.
Hull and Sunderland Run Smoothly with the Best Quality Road Surfaces
Using Gov.uk data, we also took a look into the percentage of roads that were classified as being in need of maintenance in each city. Of the roads in their cities, only 1% in Kingston upon Hull and Sunderland were deemed to be in poor condition and requiring maintenance in the latest RCE (Road Conditions in England) measurements. Coventry, Newcastle upon Tyne, and Sheffield were also well rated with their Road Condition Indicator (RCI) scores, with only 1.5% of their roads requiring maintenance, on average.
Liverpool may have a low ratio of vehicles per capita, but their roads have evidently not escaped wear and tear, as the Merseyside city was last on our list with an average of 11% of their roads being assessed to be in poor condition. Bristol also had a high percentage at 9.5%, with Bradford rounding out the unwanted bottom three places with 9% of their roads requiring maintenance.
Research for Car Lease Special Offers found that Bradford were actually spending the most of all city councils on pothole repairs, with a whopping £3,867,858 forked out to fix them in the financial year of 2020/21. Stoke-on-Trent was fourth bottom of our road surface quality list with 8% of their roads needing maintenance, so they may need to fork out even more than the £15.2m they spent overall on their roads in 20/21.
Portsmouth’s Roads Are Not Clogged by Bus Routes
When driving through the centre of UK cities, bus routes and designated bus lanes can often get in the way and cause plenty of annoyance. If you want to avoid getting stuck behind buses, then Portsmouth may be the city for you. They only have 53 bus routes, serving 386 bus stops, compared to the next lowest in Wolverhampton with 67 bus routes and 1192 stops. Kingston upon Hull once again scores well here, in third place with 76 routes (1877 stops).
If getting stuck behind buses all the time is going to set off your road rage, then it’s best to avoid driving in the middle of London, as their 700 bus routes and 19,000 stops are often a nightmare to navigate. The capital city was bottom by quite the distance on this metric, followed by Manchester with a huge 333 bus routes and 4394 stops. Glasgow is middling for a lot of other metrics in our research, but is in the bottom three here, with 290 bus routes and 7162 stops clogging up the roads.
The latter two city’s councils appear to be benefitting greatly from their heightened number of bus lanes, as This Is Money research in 2020 showed that they were the two councils that profited most from bus lane fines, with Manchester’s bus lane fines totalling nearly £8.4m, and Glasgow council pocketing £2.8m in the 2019 financial year.
Methodology
To crown the overall best and worst UK cities for driving, we gave each city a score of between 1 and 25 for each of the eight topics of data, with each weighted evenly. For example, Coventry received a 1 for congestion, while Edinburgh received a 25. We then calculated the total scores for each city, thus ranking them from 1-25 to declare an overall winner, with the lowest scorer (Reading) being ranked as number 1 and the best city for driving. The lower the score, the better that city was declared for the metric in question.
Sources:
Road Safety: CrashMap
City centre crashes were reviewed for the last five year period, stretching from 2017 to 2021. The lower the number of incidents, the better the score.
Congestion: TomTom
The percentage of extra time it takes to travel on the city’s roads due to traffic congestion. For example, a 35% congestion level in Edinburgh means that a 30-minute trip will take 35% more time than usual. The lower the congestion %, the better the score.
Parking: Parkopedia
We reviewed the number of parking spaces in each city’s car parks, with the cities then ranked by the number of cars per public parking space. The cars per public parking space data was calculated by the number of vehicles registered in the city divided by the total number of city centre parking spaces (taken from Parkopedia). The lower the number of cars per public parking space, the better the score.
EV Charging Devices and Vehicles per Capita: Gov.uk
EV Charging Device data was ranked via the number of public charge points in each city per 100,000 people of their population. The higher the number of EV chargers per 100,000 people, the better the score.
Vehicles per capita was then calculated by dividing each city’s population by 1000 to get a quotient, with the number of registered vehicles in each city then divided by the quotient number. The lower the number of vehicles per capita, the better the score.
Road Condition: England - Gov.uk, Wales - StatsWales.gov, Scotland - Transport.Gov.Scot
We reviewed the percentage of principal and non-principle classified roads where maintenance was suggested, with each city given a % of their roads that are in ‘poor condition’. The lower the % of poor condition roads, the better the score.
Bus Routes: GeoPunk
The number of bus routes in each city was analysed from the GeoPunk.co.uk site, with the lower the number of bus routes the better the score, as there will be less buses and bus lanes blocking up the local roads.
Air Quality: IQAir
The average Air Quality Index (AQI) score was taken from data for a week in May 2022 and then averaged out for each of the 7 days. The lower the AQI score, the better.
Enjoyed this article? Read more of our latest blogs below:
- Ten Essential Items to Keep in Your Car
- What Happens at the End of Your Lease?
- How Long Will a New Car Take to Arrive?
- Five Common Fleet Management Mistakes and How to Avoid Them
Want to know more about car leasing?
For all our latest news and blogs click HERE.
Or are you looking to understand the company car, fleet management or any other aspect of fleet vehicles? If so, then check out our Guide Pages.